

Table of Contents
🧙♂️ Wanna give UX writing a go? Try our free course A Taste of UX Writing
Welcome to the 2022 writers in tech salary survey report! It’s been over a year since our last report, and we’ve got lots of new data.
This year, 1200 people around the world completed the UX Writing Hub’s annual salary survey! That’s up from 757 last year. Thanks to all who participated! We’ve spent the past few weeks digging into the data, and we’re excited to share the fascinating insights we’ve uncovered. To see individual country data, use our salary calculator.
While we often use the term “UX writer”, the survey covered lots of different titles, including content writer, technical writer, and many more. We’re really talking about all writers working in tech.
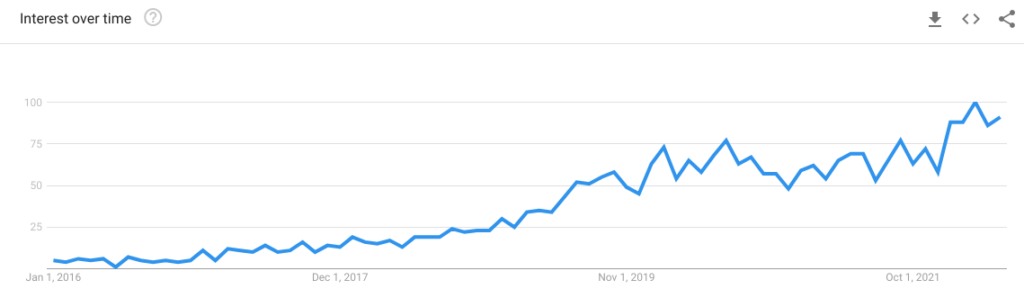
😎 Things look good for writers in tech
Last year, we said it was a good time to be a UX writer, and it still is:
But, it’s also a good time to be a writer in tech, no matter what the role or title. Here are some of the many titles writers in tech hold:
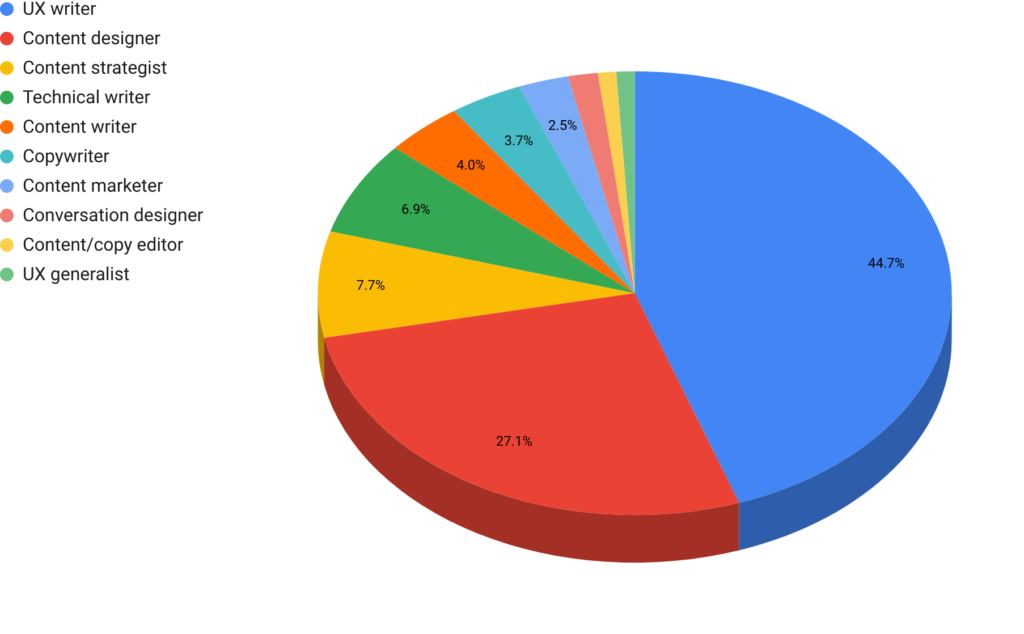
✍️ Types of writers in tech
| Title | Percentage |
| UX writer | 44.7% |
| Content designer | 27.1% |
| Content strategist | 7.7% |
| Technical writer | 6.9% |
| Content writer | 4.0% |
| Copywriter | 3.7% |
| Content marketer | 2.5% |
| Conversation designer | 1.5% |
| Content/copy editor | 0.9% |
| UX generalist | 0.9% |
Like last year, UX writer is the most common job title in our survey. In fact, more people reported having that title this year: 44.7%, up from 34.6% last year, a 10% increase. There are also more content designers this year: 27.1% compared to 14.3% last year. The increase in UX writers and content designers is accompanied by a decrease in content strategists and technical writers—7.7% and 6.9% respectively, down from 11% for both last year.
It’s great to see that UX writer and content designer have become more common titles. We hope that means that companies are recognizing the importance of this valuable work.
There are differences in titles across countries. For instance, in Latin America, there is a 3:1 ratio of UX writers to content designers. In continental Europe, more than 55% are UX writers while content designers are only about 18%. Elsewhere, the content design title is rising: in North America, UX writer and content designer are close to an even split, while in the U.K., content designers take about 40% to UX writer’s 35%.
Overall, UX writer and content designer continue to trend upward, while content strategist is in a decline.
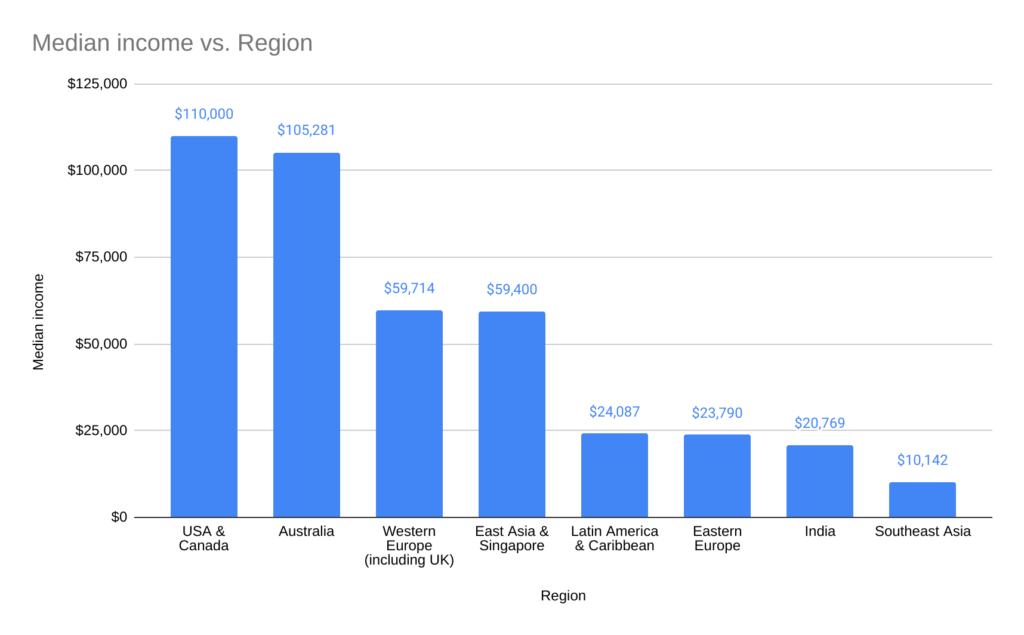
🌍 Global average for writers in tech
Writers in tech from all over the world submitted responses to the survey. For full-time writers working in tech, the global median for annual gross income ticked up a bit from last year’s 65K USD to 67K*. But if we break things down by region we get a clearer picture. (All figures in this article are in USD.)
See average and median salaries for various countries with our salary calculator.
| Region | Average hourly rate (USD) |
| Global | $58 |
| United States of America | $74 |
| Israel | $70 |
| France | $57 |
| United Kingdom | $52 |
| Italy | $52 |
| Canada | $48 |
| Germany | $49 |
| Spain | $42 |
| India | $33 |
| Poland | $28 |
| Brazil | $19 |
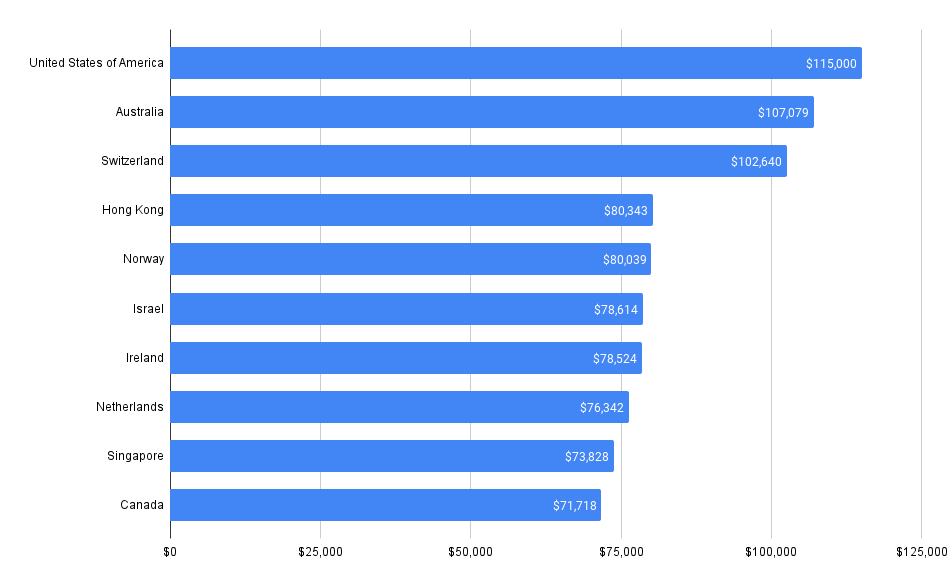
🪙 Top ten countries
Here are the top ten countries with the highest salaries. Like last year, the US, Switzerland, and Australia are still the top three earners, with Australia making the biggest leap from 88K to 107K! 🦘| Country | Median full-time income |
|---|---|
| United States of America | $115,000 |
| Australia | $107,079 |
| Switzerland | $102,640 |
| Hong Kong | $80,343 |
| Norway | $80,039 |
| Israel | $78,614 |
| Ireland | $78,524 |
| Netherlands | $76,342 |
| Singapore | $73,828 |
| Canada | $71,718 |
🤔 In-product or out?
In previous research, we’ve seen that certain titles tend to focus more on in-product copy than others. For example, UX writers, content strategists, and content designers tend to be product-focused, while technical writers, content writers, copywriters, and digital marketers spend less time writing product copy. So, do writers who work “in-product” make more than those who don’t?
Yes, but not by much! Globally, the median salary for product-focused writers is about 68K, while for non-product-focused writers it’s 62K. In the USA, the medians are 120K to 90K, and most other countries showed similar trends. So while product writers are making a bit more, pretty much all writers working in tech are doing well.
👩💻 Good news for the gender gap
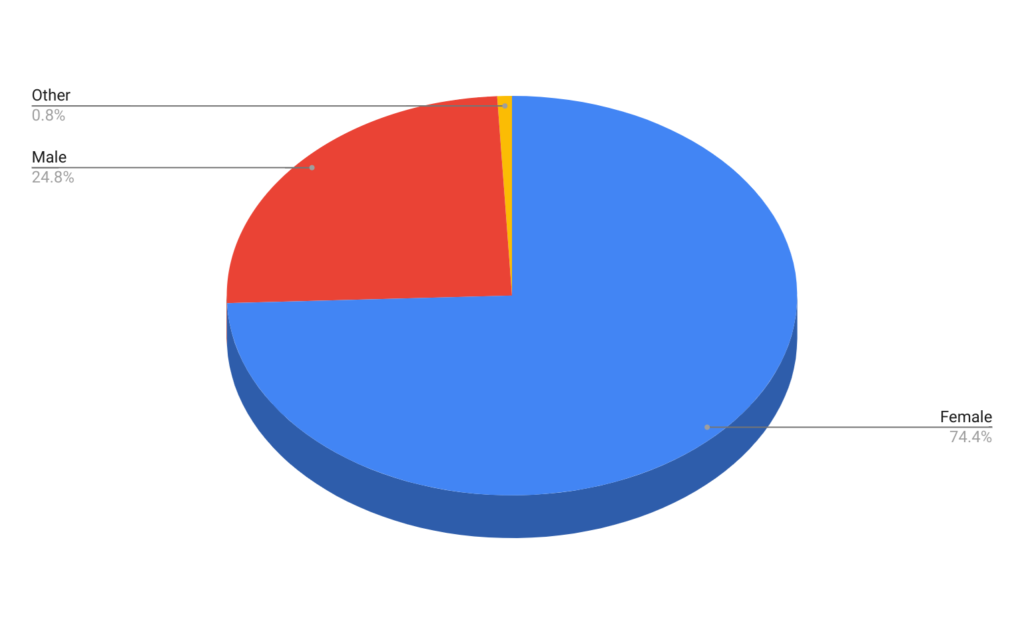
Like last year, we didn’t find evidence that women make less than men in UX writing—in fact, they make a bit more: internationally, women make a median salary of $67,811, while men make $62,000.
It varies by country, but among countries with enough respondents, there were no major discrepancies. For example, in Canada, men made slightly more at 72K to 70.5K men/women, while in Sweden, it was about 58K to 54K women/men.
And again like last year, women were much more strongly represented in our survey: about a 3:1 ratio of women to men among writers in tech. Other responses, including non-binary, gender-fluid, trans, and more made up a bit less than 1%. Median incomes for these responses tended to be in line with female and male incomes.
Looks like women are thriving as writers in tech companies.
👶👵Compensation increases with age and experience, and seniority counts
Think Gen Z is getting the highest pay in tech? Not according to our survey results, which showed pay increasing pretty consistently through age 60. Age may be a proxy for experience here. Compensation moves in lockstep with years of experience. This is expected, but may make career changers balk at the possibility of a pay cut.
Years experience:
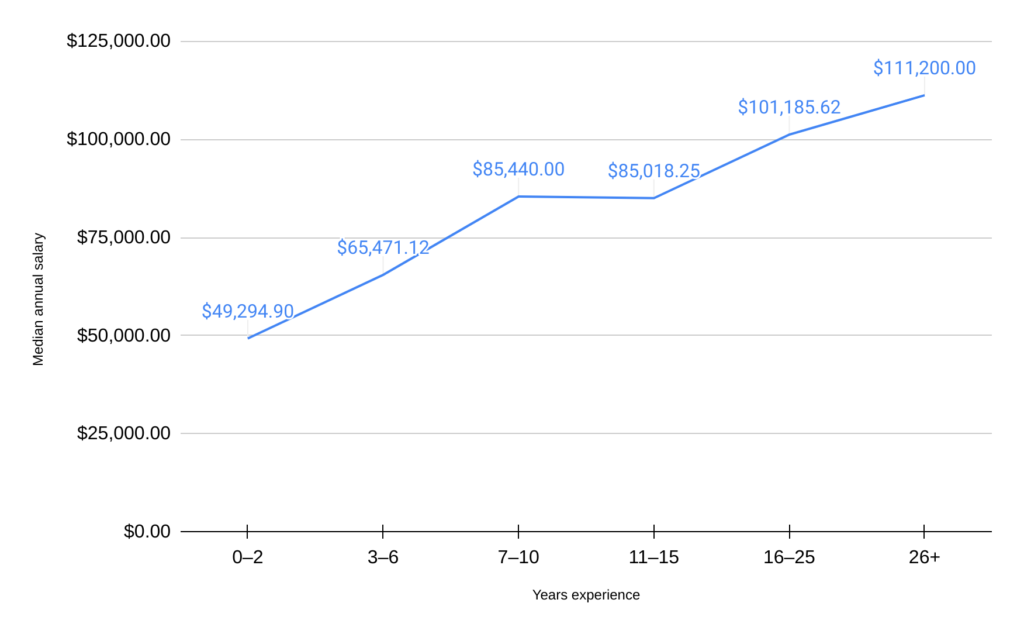
Unsurprisingly, with seniority comes higher salaries. However, in some countries, the gap isn’t huge. In the US, all but junior roles and interns make over $100,000. And junior roles make $75,000…nothing to sneeze at. The UK is similar, but slightly lower across the board. Internationally, median salaries are a bit lower for junior and mid-level employees, but still very reasonable, especially with the prospect of higher salaries for more senior roles in the future.
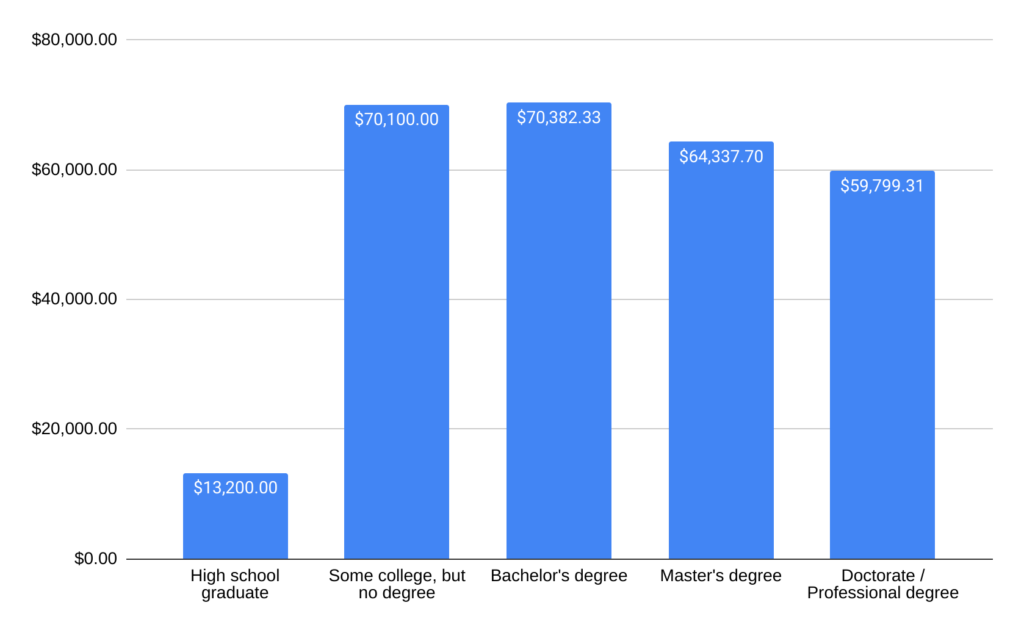
🎒 We don’t need no education (OK, we need some)
If you’re wondering whether you need to go back to school to improve your UX writing fortunes, the answer seems to be no. While people with bachelor’s degrees made more than anyone, respondents who had “some college, no degree” made only a little bit less … and more than those with MAs and PhDs. This may change as more universities begin teaching UX writing, but for now, it seems that educational background doesn’t have a big impact on earning potential in content design.
It’s worth noting that 60% of respondents had a Bachelor’s and 32% had a Master’s degree. This means nearly 95% of respondents have a degree.
🏦 Industry and company size
While the survey reminded us yet again that UX writers can work in all kinds of companies across every industry you can think of, some trends emerged. More than half of the people surveyed work in enterprise companies (1000+ employees).
Here’s a breakdown of the percentage of respondents per company size:
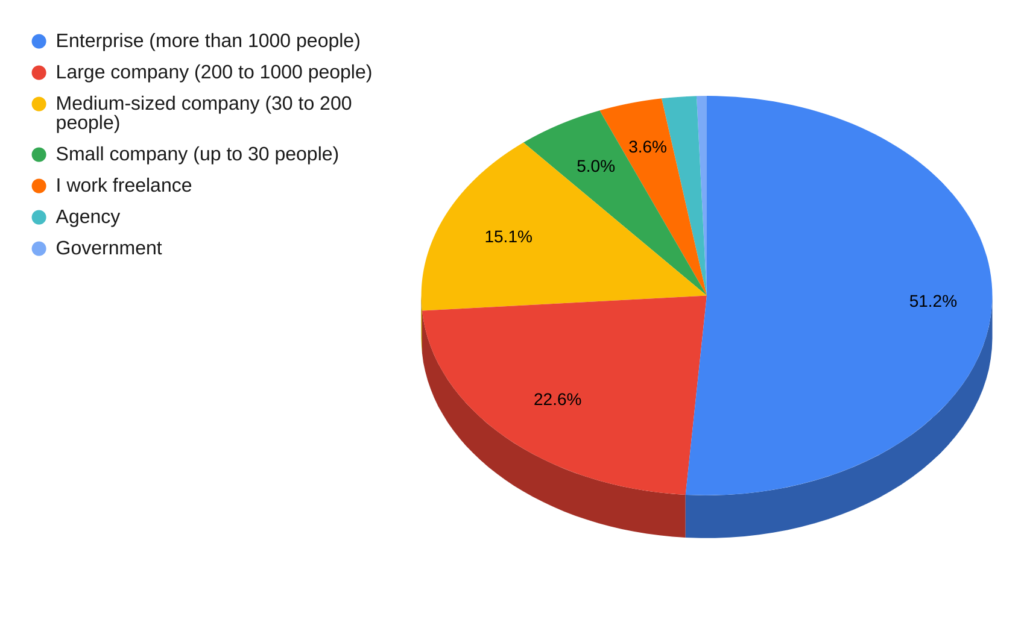
| Compay Size | Percentage |
| Enterprise (more than 1000 people) | 51.2% |
| Large company (200 to 1000 people) | 22.6% |
| Medium-sized company (30 to 200 people) | 15.1% |
| Small company (up to 30 people) | 5.0% |
| I work freelance | 3.6% |
| Agency | 2.0% |
| Government | 0.6% |
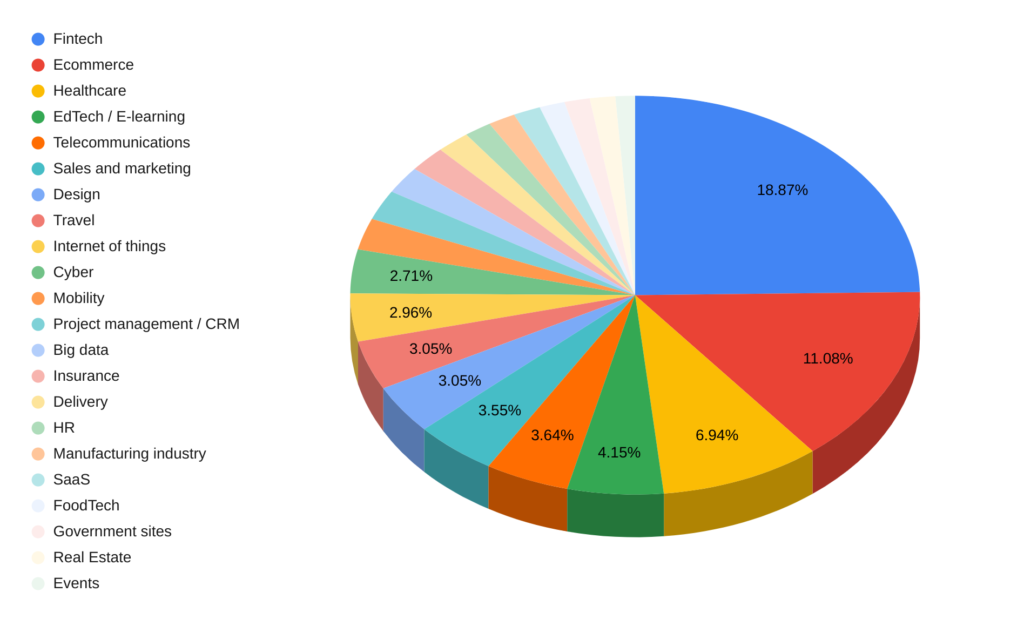
There are tons of tech industries, so the writers we surveyed work in an incredibly wide range of fields. Fintech (18.87%), ecommerce (11.08%), and healthcare (6.94%) were the most common, but many, many more industries were represented.
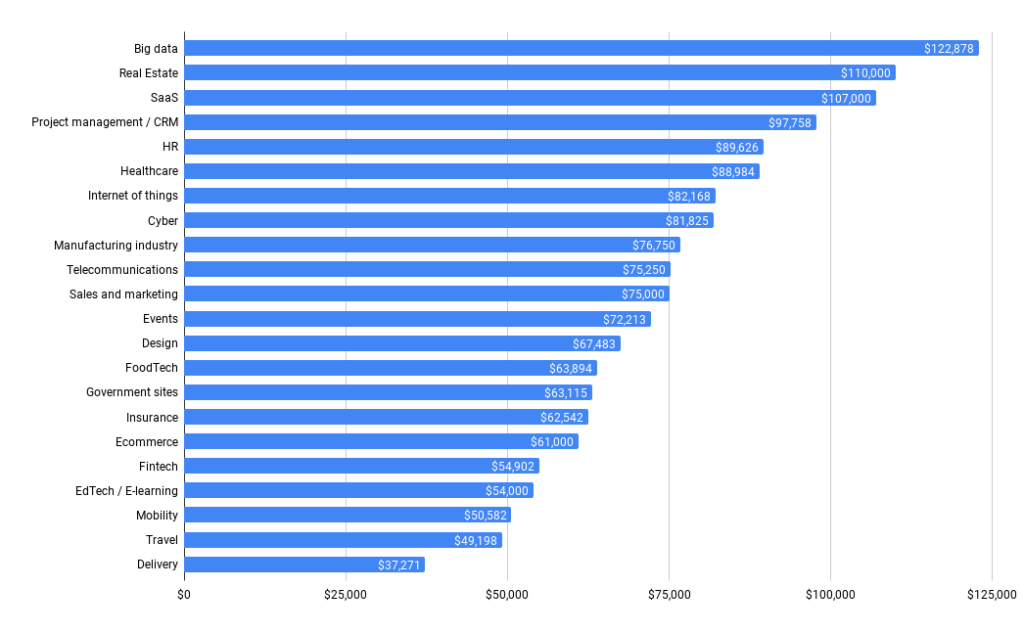
In terms of compensation, big data ($122,878.18), real estate ($110,000), and SaaS ($107,000) have the highest salaries, but many other industries also pay quite well.
| Industry | Median income |
|---|---|
| Big data | $122,878 |
| Real Estate | $110,000 |
| SaaS | $107,000 |
| Project management / CRM | $97,758 |
| HR | $89,626 |
| Healthcare | $88,984 |
| Internet of things | $82,168 |
| Cyber | $81,825 |
| Manufacturing industry | $76,750 |
| Telecommunications | $75,250 |
| Sales and marketing | $75,000 |
| Events | $72,213 |
| Design | $67,483 |
| FoodTech | $63,894 |
| Government sites | $63,115 |
| Insurance | $62,542 |
| Ecommerce | $61,000 |
| Fintech | $54,902 |
| EdTech / E-learning | $54,000 |
| Mobility | $50,582 |
| Travel | $49,198 |
| Delivery | $37,271 |
🙋 More to come
Those were the highlights from our 2022 UX writing salaries survey. We hope the news was reassuring—UX writers, content designers, and many other writers in tech continue to thrive.
Want more details? See the results for individual countries in our interactive salary calculator.
And stay tuned for more articles coming soon: we’ll explore data about remote work, freelancing, ratios of writers to designers, and—maybe most important—how happy UX writers are.
Anything else you’d like us to cover? Let us know!
📊 More reports
UX Writers and Designers in the Workplace
✏️ Breaking into the field
Thinking about transitioning to UX writing or content design? That’s an excellent idea, and we’d be happy to help you on your journey! Start by taking our free course.
*The figures in this article are based on multiple global currencies converted to USD according to those currencies’ exchange rates at the time of writing. Figures in the salary calculator will change along with changes in FX markets.
**Special thanks to Caroline Rothnie, Aaron Raizen, and other UXWH team members for their contributions.